Key Terms
Volatility
A measure of how widely an asset's price swings over time, describing the size of movements rather than their direction.
By the Investfora Research Desk
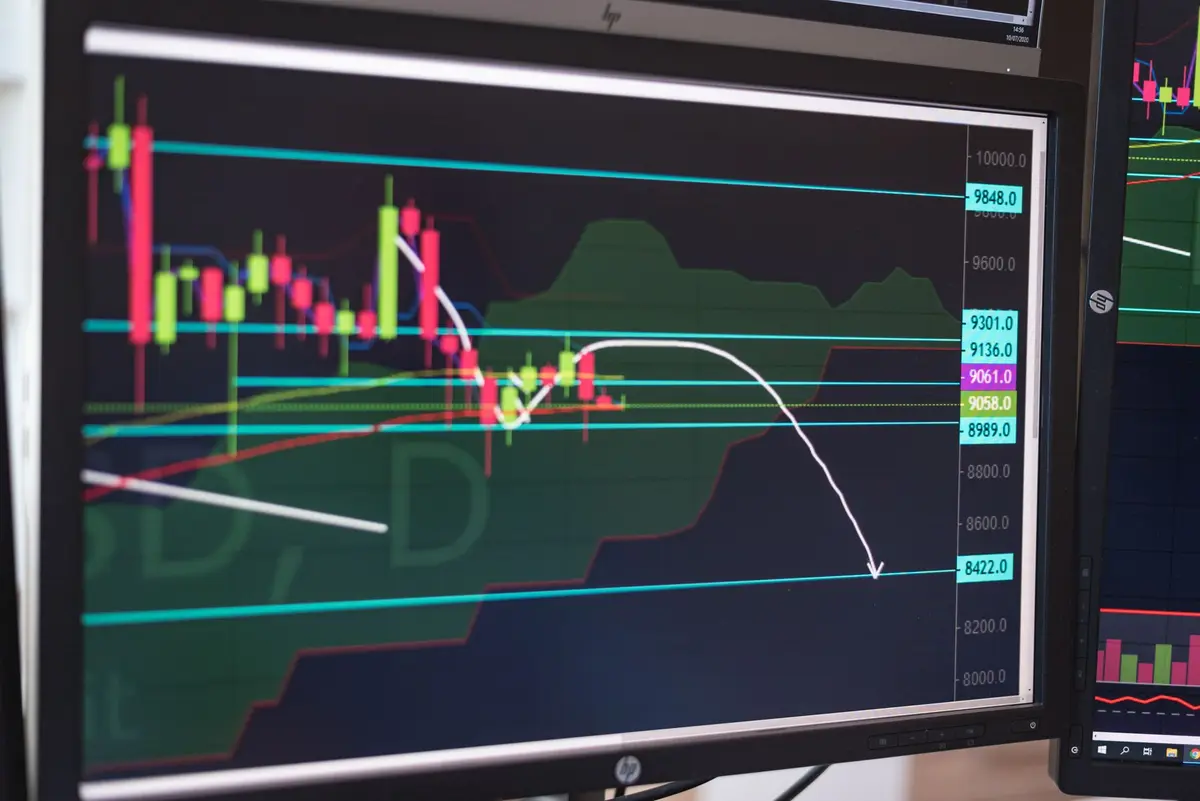
Volatility is a measure of how widely a price swings over time. It describes the size of movements, not their direction: a highly volatile asset is one that moves a long way in short periods, whether up, down or — most commonly — both. A price that grinds steadily in one direction can have low volatility, while a price that lurches between sharp gains and sharp losses has high volatility even if it ends up exactly where it began.
A worked example
Take two hypothetical shares, each starting and finishing a month at 100 pence. Share A drifts between 98 pence and 102 pence, with typical daily moves of about 1 penny — one per cent of its price. Share B swings between 70 pence and 130 pence, with daily moves of about 10 pence — ten per cent. Over the month their returns are identical, at zero, yet Share B has been ten times as volatile.
Volatility does not tell you which way a price is heading, and it does not distinguish a rise from a fall of the same size. Nor is a record of low volatility a promise of future calm: the measure describes how a price has behaved, not how it must behave next.